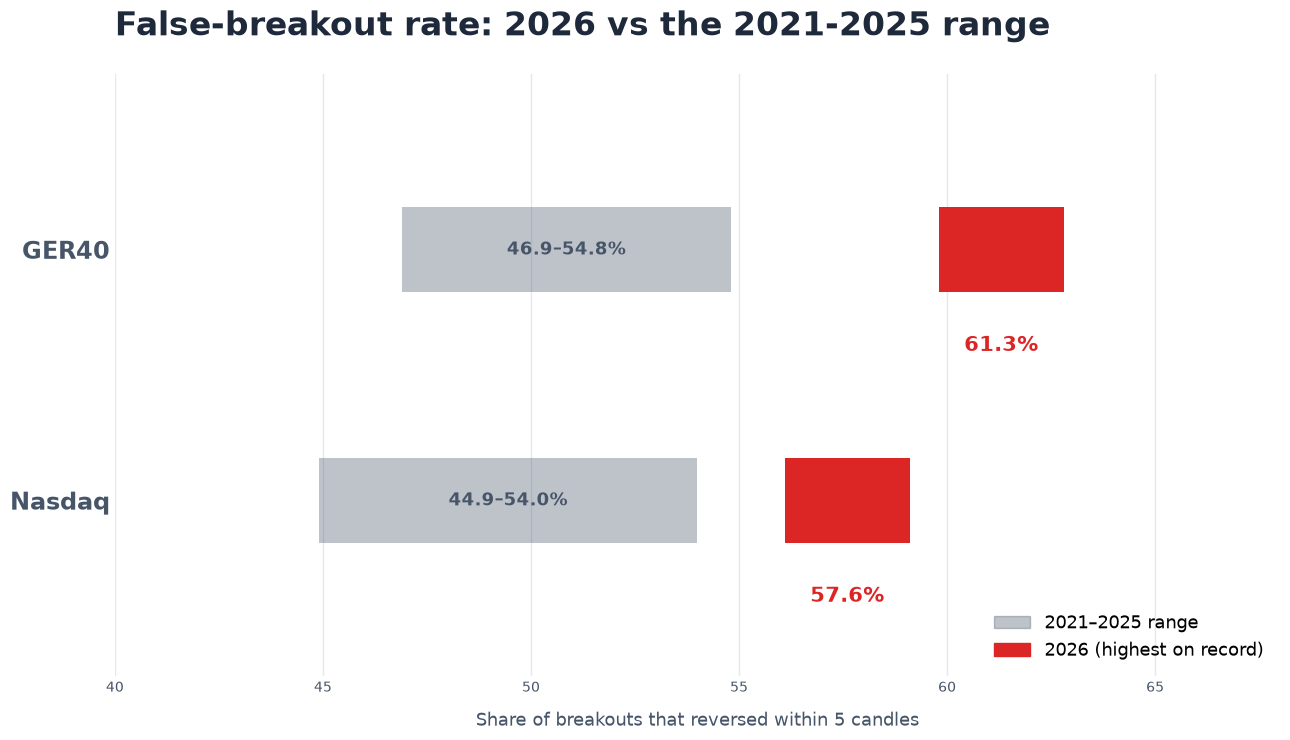
I test a lot of systems against historical data, and most of the time the goal is finding an edge to trade. Every so often, the more useful thing that falls out is a measurement instead of a strategy, and this year handed me one that says more about the market itself than any strategy could: breakouts on GER40 and Nasdaq have been failing at a higher rate than at any point in the data I’ve got.
What a false-breakout rate measures
Take any clean channel or range breakout, price closing beyond a recent high or low, and check whether it holds. A false breakout is one that reverses back through the same level within a handful of candles, the kind of move that looks like conviction on the break candle and turns out to be nothing. Measure that across a full year and you get a single number: what share of this instrument’s breakouts held up, and what share were noise wearing a signal’s clothes.
The 2026 numbers
Running that measurement year by year, 2026 stands out clearly on both instruments I checked. GER40’s false-breakout rate this year sits at 61.3%, against a range of 46.9% to 54.8% in every year back to 2021. Nasdaq sits at 57.6%, against 44.9% to 54.0% over the same stretch. Both are the highest reading in the whole period, and neither is close to second place.
That’s not a subtle shift. On a typical year, a bit under half of GER40’s breakouts fail. This year, well over half do, and the same pattern shows up independently on a completely different instrument.
Why it hits breakout trades and helps rejection trades
The mechanism is straightforward once you see it, and it cuts in opposite directions depending on what kind of setup you trade. A breakout entry triggers the moment price closes beyond the level, so a higher false-breakout rate means a bigger share of those triggers are about to reverse, more losing signals dressed up exactly like the winning ones. A rejection entry, a pin bar or a wick that tests a level and snaps back, has the opposite relationship to the same statistic, because that failed test is the entry trigger, not a side effect to guard against. More false breakouts doesn’t dilute a rejection strategy’s signal, it directly produces more of them.
That’s the part to hold onto if you trade discretionarily instead of systematically: this isn’t two unrelated observations, whipsawy breakouts and strong rejection setups, it’s one underlying condition producing both effects on the same instruments in the same year.
What this means if you’re not running a backtest
You don’t need a testing pipeline to act on this, just a bit more patience than usual around an obvious level. On the breakout side, this is a good year to lean harder on waiting for a close beyond the level and a second candle of follow-through before trusting it, the distinction covered in How to Trade Trendline Breaks and Breakouts and Fakeouts, rather than acting on the first candle that pokes through. On the other side, a wick that tests a level and gets rejected deserves a closer look than it might in a calmer year, the setup covered in Failed Breakouts.
None of this means breakout trading has stopped working or that every wick is suddenly a signal. It means the odds on both setups have shifted a bit this year, on these two instruments specifically, and that’s something to keep in mind before the next obvious level gets tested.
Nothing on this page is financial advice. Levels and views here are a starting point for your own analysis, not a signal to trade.